Plano, TX

Median City, all urban cities and towns in U.S.: 55%
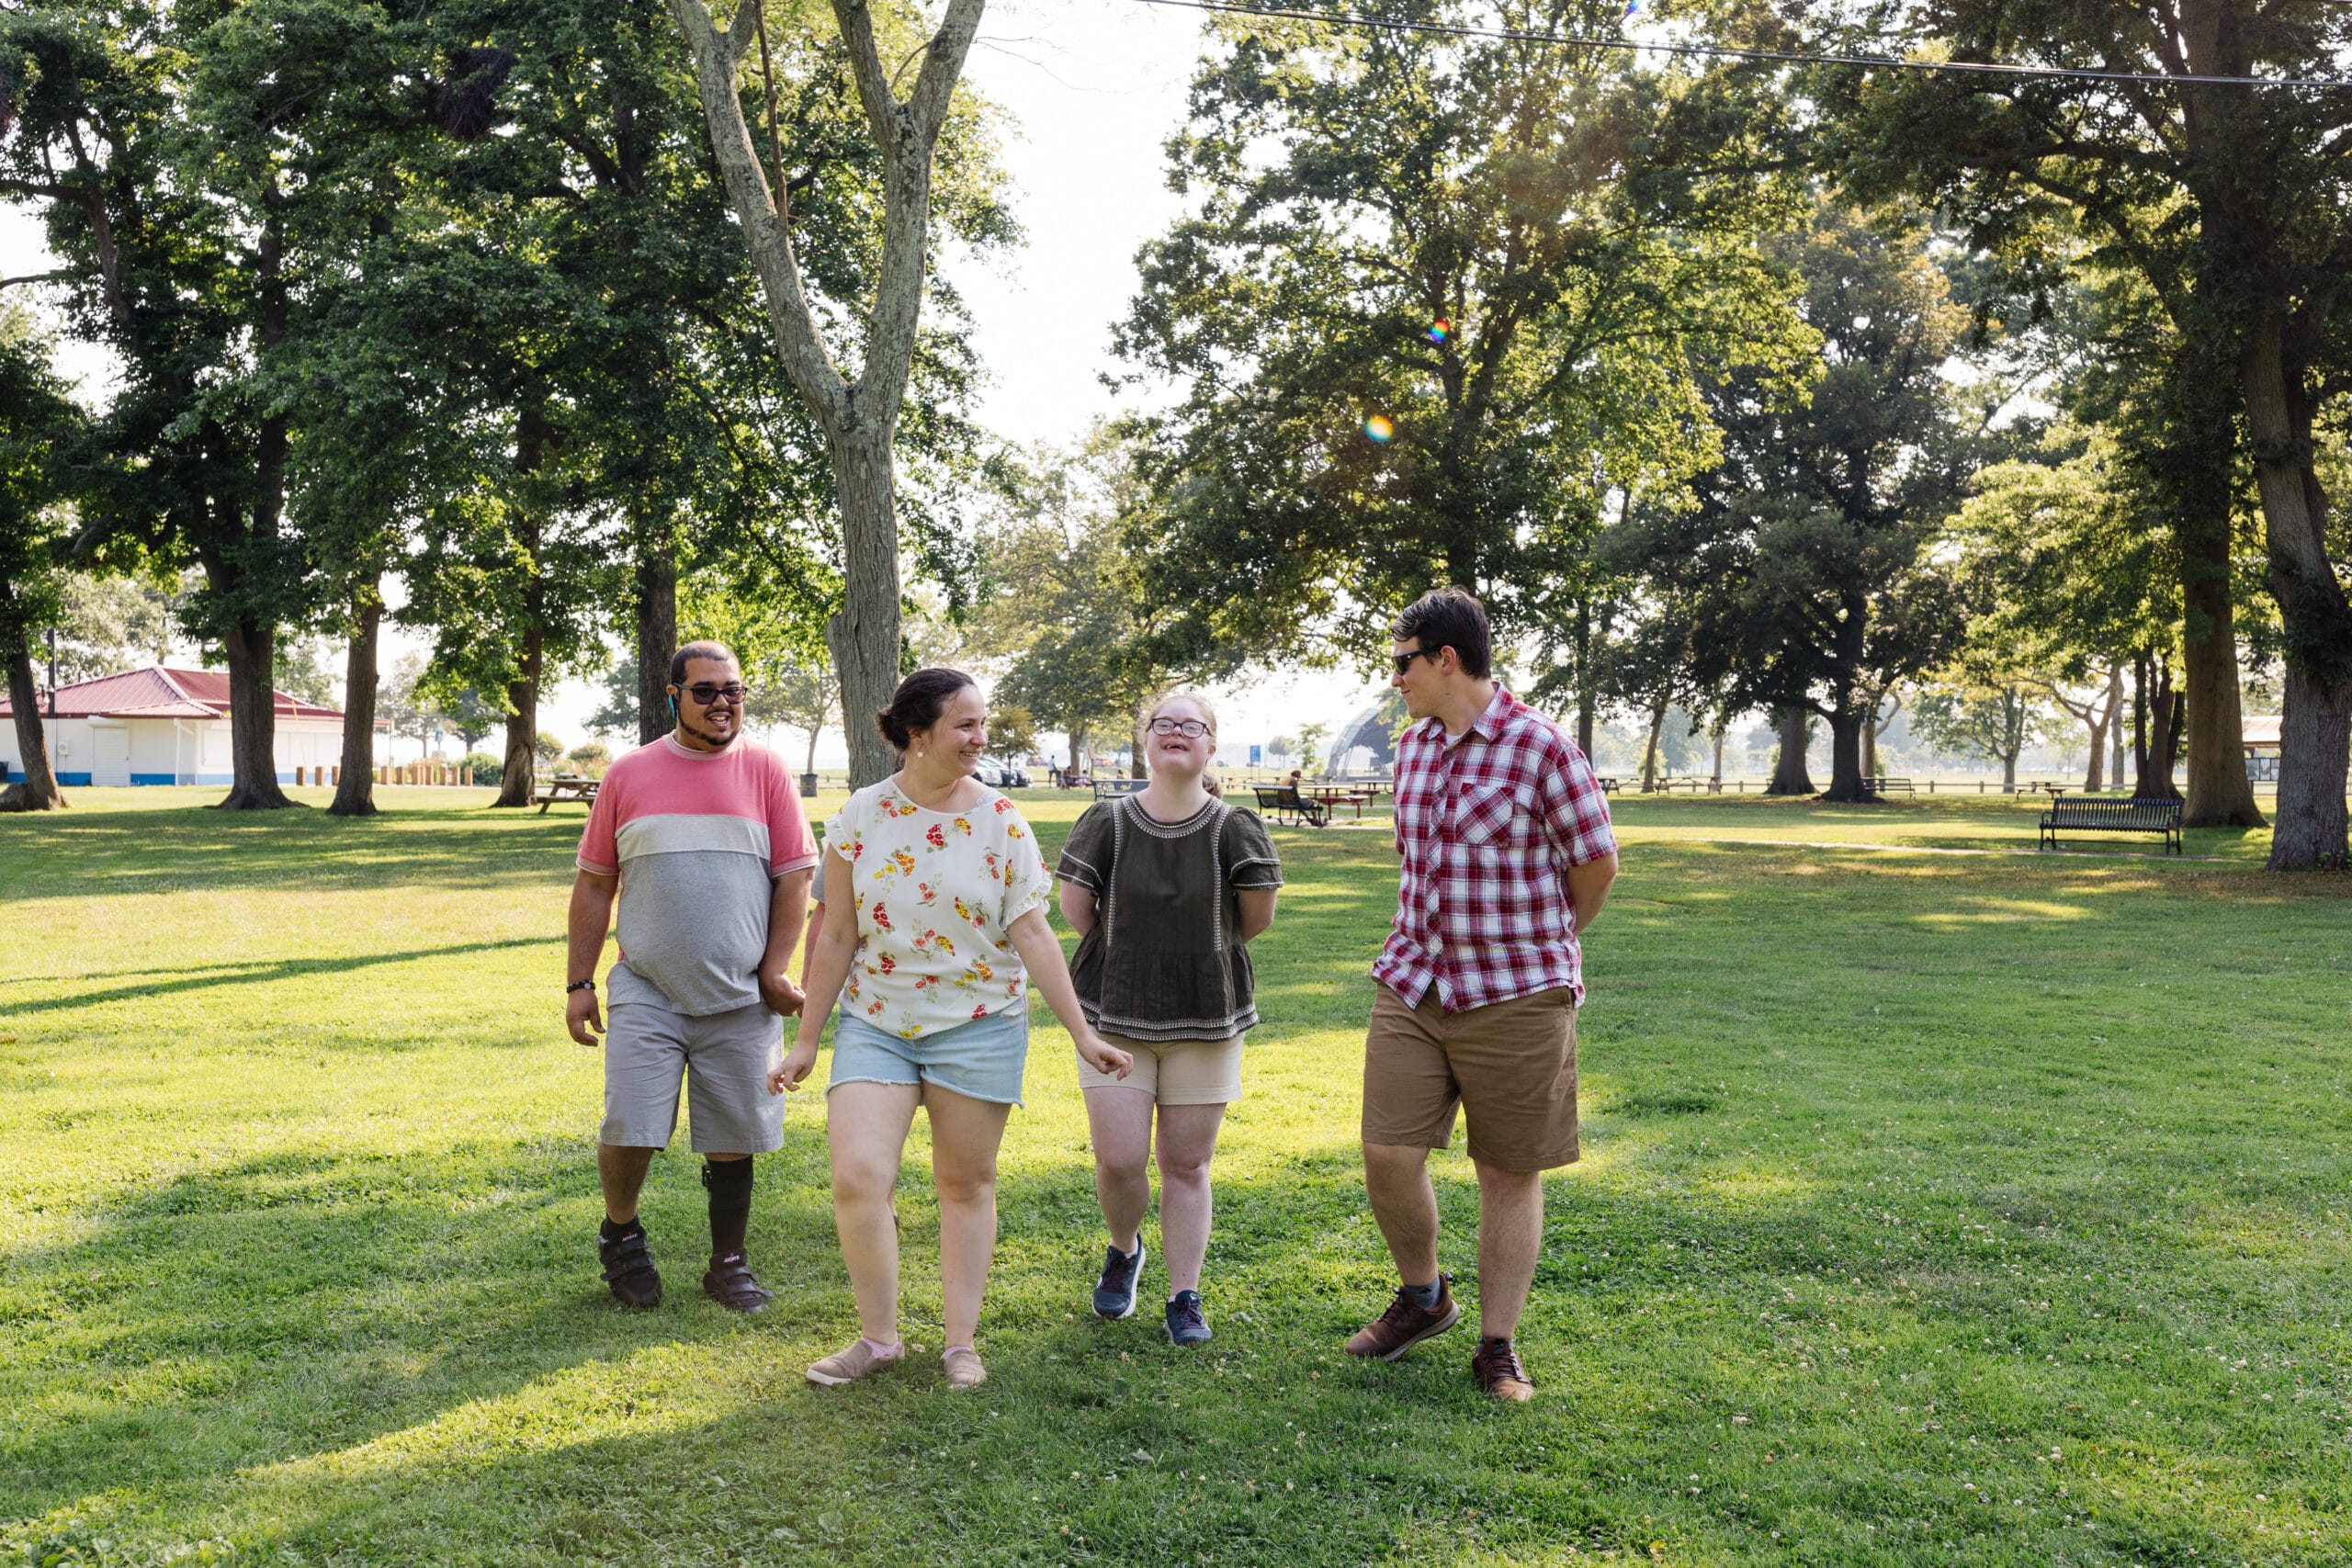
We’re working to ensure that every person, in every neighborhood, in every city across America has a quality park within a 10-minute walk of home.
-
City agency$180 (99%)
-
Other public agencies$0 (%)
-
Private organizations$0.04 (0%)
-
Monetized volunteer hours$1 (1%)
- National benchmark: Relative park spending by organization type
- Average among 100 most populous cities
- City agency: 86%
- Other public agencies: 7%
- Private organizations: 5%
- Monetized volunteer hours: 2%
- Total per capita spending: $124 per person
Trust for Public Land has mapped park access for every urban area in the U.S., including Puerto Rico. Our ParkServe® mapping platform helps you pinpoint park investments to address park need, climate, equity, and health.
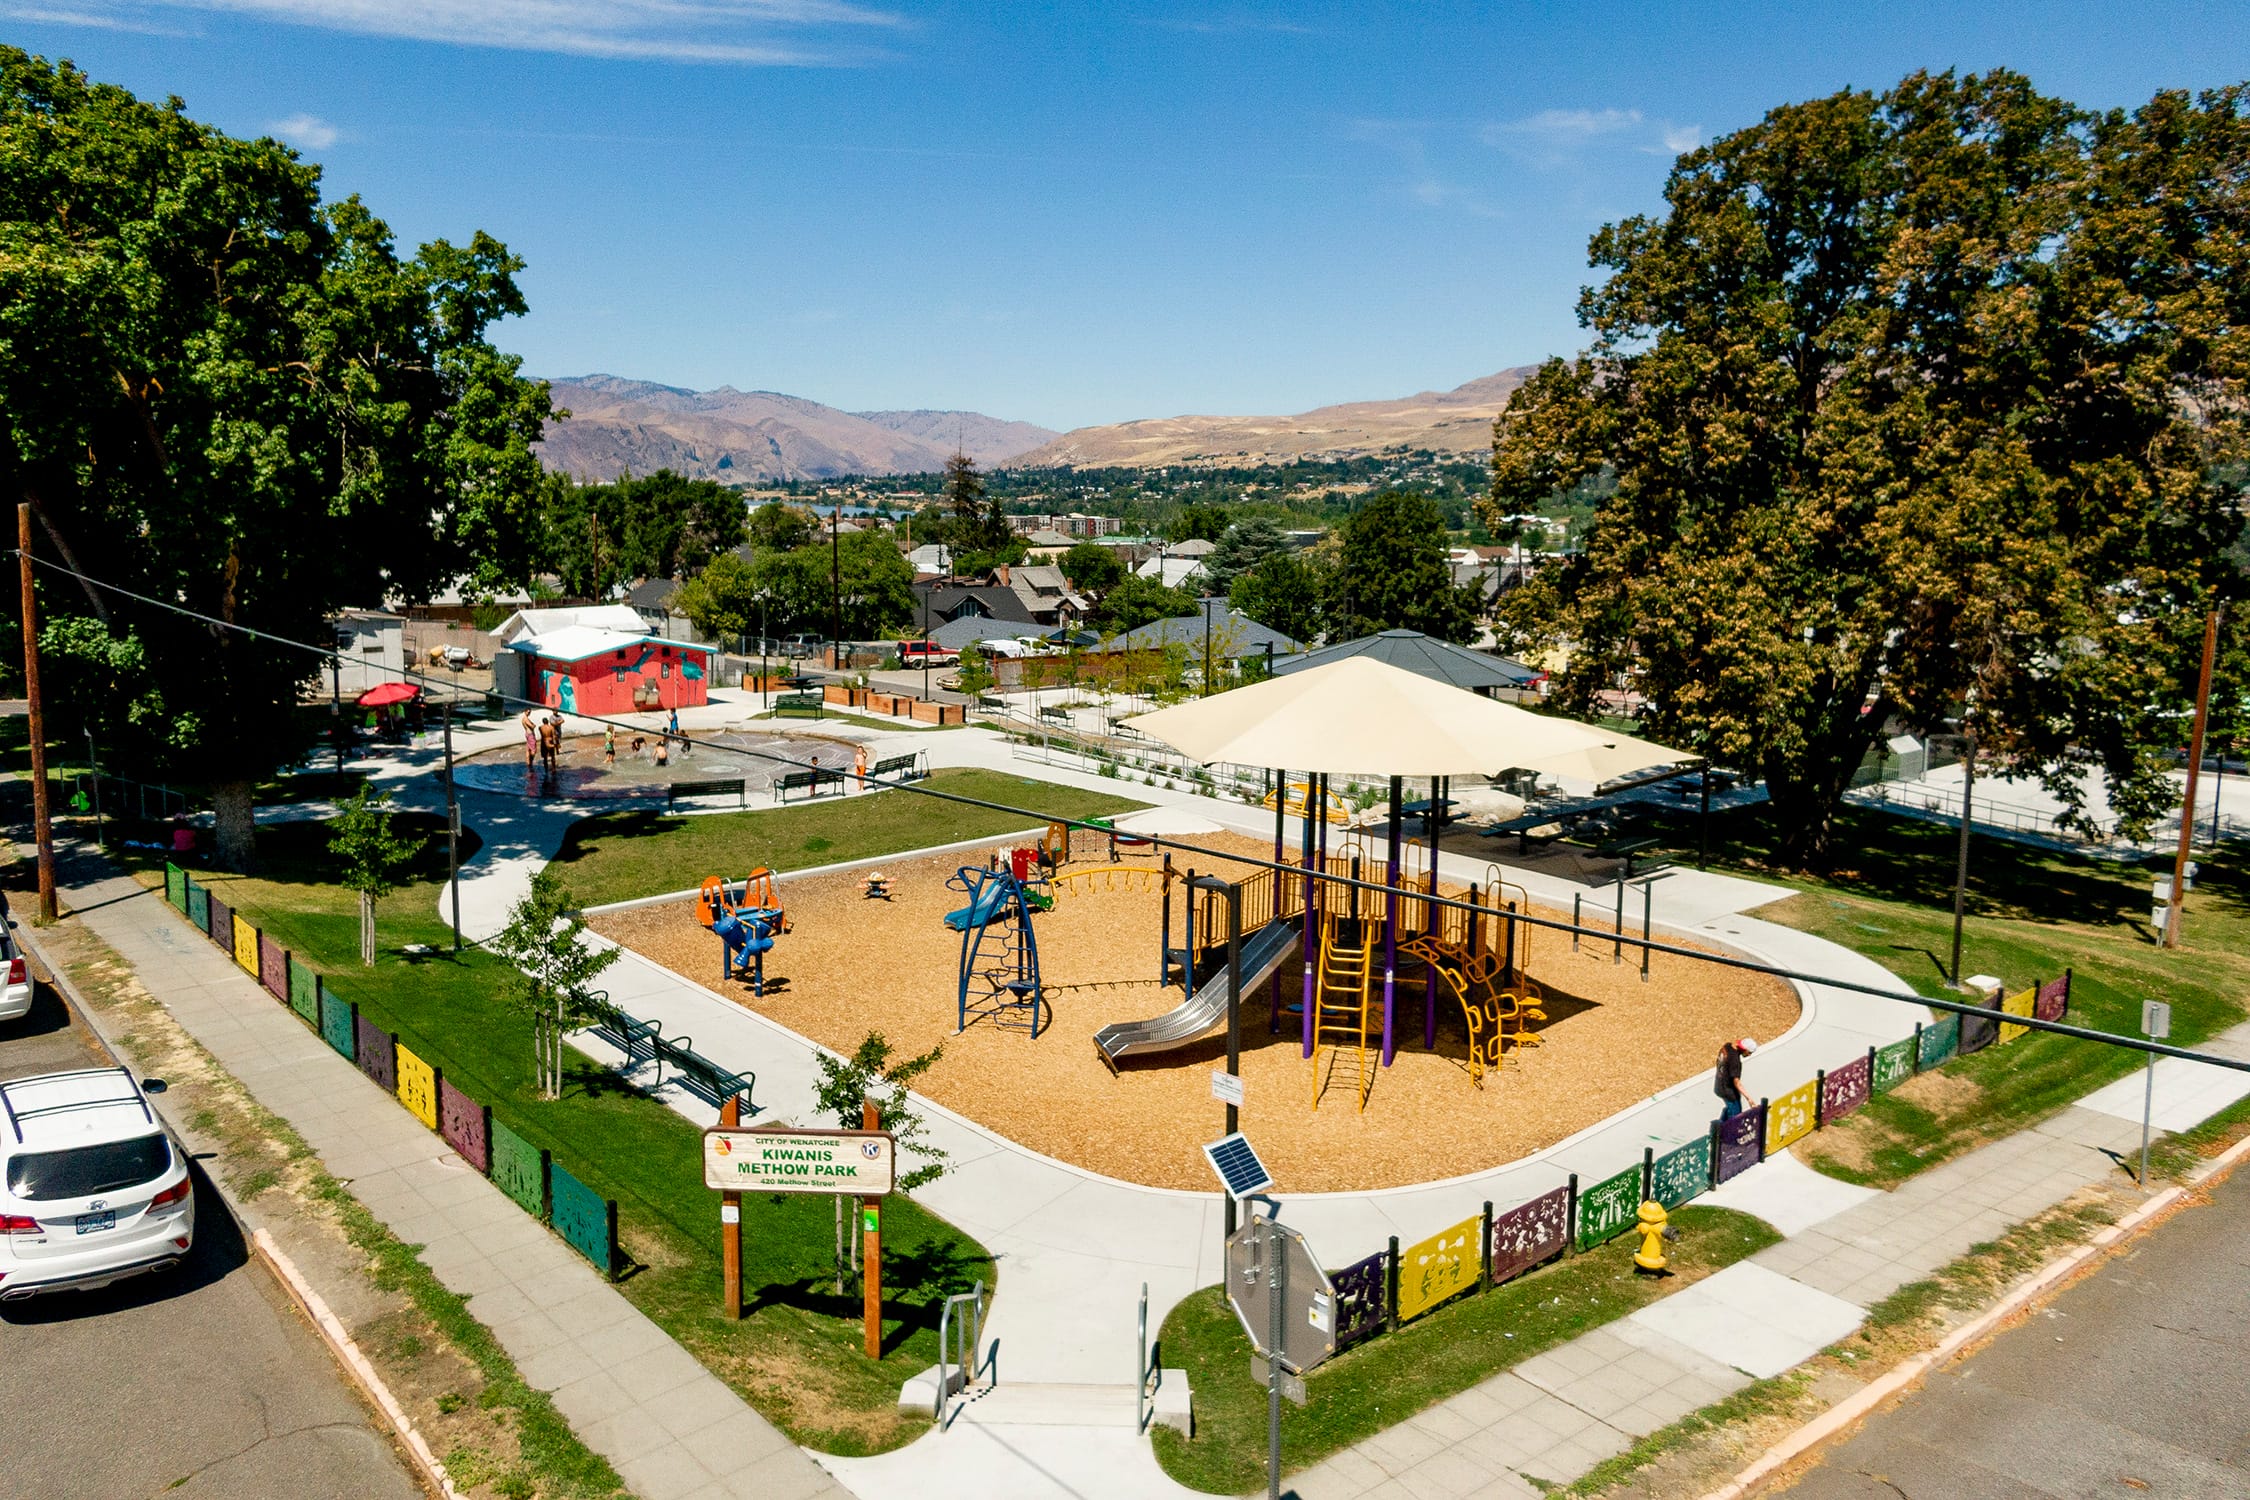


As City leaders, we are constantly striving to make Plano a better place to live, work and play. Our Parks and Recreation Department certainly upholds the high standard of why we call Plano “City of Excellence”. From our 85 park sites, four recreation centers and two Audubon Certified nature preserves to our 4 outdoor swimming pools, world class athletic facilities and two 18 hole golf courses, we offer something for everyone of our residents. The majority of our 290,000 residents live within a 10 minute walk to a local park.
-
Park Data Downloads
Explore our comprehensive ParkServe® dataset which provides park data for over 15,000 cities and towns in the U.S., including park polygons, service areas, priority areas, trails, and playgrounds. Download historic ParkScore® rankings, which compare park systems across the 100 most-populated cities based on access, investment, amenities, acreage, and equity. The Trust for Public Land also offers data tables for city parks, including information on amenities, acreage, staffing, spending, and volunteers.
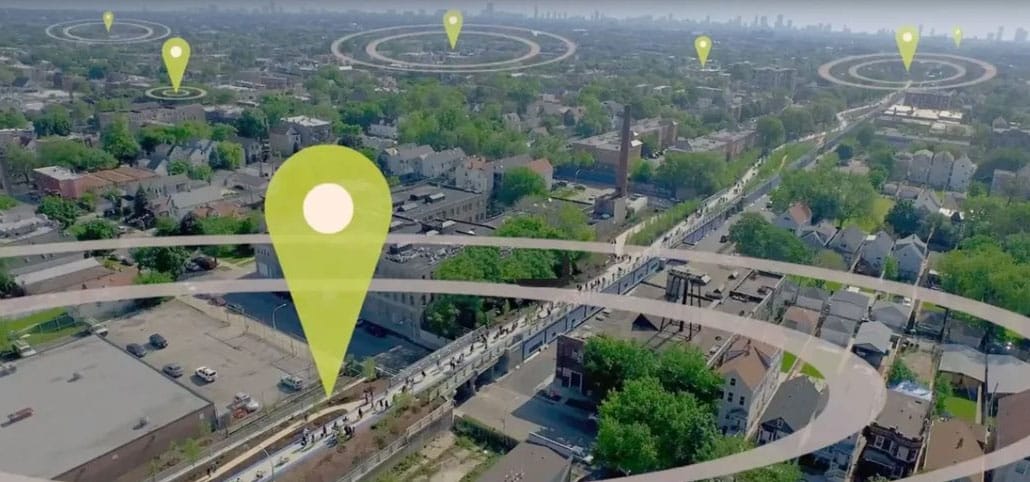
Our data reveals park access levels for every urban city and town across the United States and Puerto Rico. This powerful tool provides communities with information they need to help close the park equity gap. Search for another community here.