Toledo, OH

Median City, all urban cities and towns in U.S.: 55%
We’re working to ensure that every person, in every neighborhood, in every city across America has a quality park within a 10-minute walk of home.

-
City agency$39 (23%)
-
Other public agencies$133.11 (77%)
-
Private organizations$0 (%)
-
Monetized volunteer hours$1.02 (1%)
- National benchmark: Relative park spending by organization type
- Average among 100 most populous cities
- City agency: 86%
- Other public agencies: 7%
- Private organizations: 5%
- Monetized volunteer hours: 2%
- Total per capita spending: $124 per person


-
Park Data Downloads
Explore our comprehensive ParkServe® dataset which provides park data for over 15,000 cities and towns in the U.S., including park polygons, service areas, priority areas, trails, and playgrounds. Download historic ParkScore® rankings, which compare park systems across the 100 most-populated cities based on access, investment, amenities, acreage, and equity. The Trust for Public Land also offers data tables for city parks, including information on amenities, acreage, staffing, spending, and volunteers.
-
ParkScore Rankings
The ParkScore rating for a city is determined by assigning points across five categories (acreage, investment, amenities, access, and equity) based on how the city compares to the 100 largest U.S. cities. Points are awarded on a relative basis within each category, and a city’s total points, out of a maximum of 500, are normalized to a ParkScore rating of up to 100.
-
City Park Facts
Each year, Trust for Public Land compiles data on parks across the nation’s 100 most populous cities, which represent about 20% of the U.S. population. This dataset aggregates park inventories – investment, acreage, and amenities – across all public and private organizations in each city, making it the most comprehensive dataset of its kind. Generate custom datasets using our interactive dashboards, or download the source Excel files.
-
Build Your Ranking
This tool allows cities to improve their park systems by exploring and weighting various scenarios related to park access, investment, acreage, amenities, and equity.
Explore the Custom Rank Application
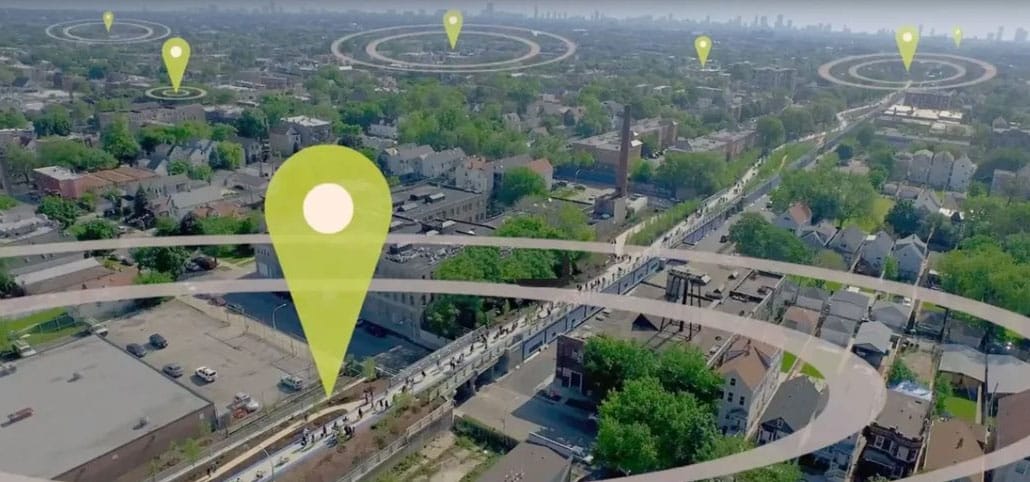
Our data reveals park access levels for every urban city and town across the United States and Puerto Rico. This powerful tool provides communities with information they need to help close the park equity gap. Search for another community here.